


![]()
« GLOBAL WARMING. HUMAN ACTIVITY OR NATURAL PHENOMENON »
1Physical Electronics – Department of Petroleum and
Natural Gas Tecnology,
Kavala Institute of Technology
2 Emeritus Professor, Department of Mineral Resources Engineering,
3 Professor Chem.
Engineer, Department of Petroleum and Natural Gas Technology,
Kavala Institute of Technology,
4Mathematician.
![]()
Abstract
Famous European scientists such as J.
Fourier [1], L. Agassiz [2] , J. Tyndal [3] and many more raised their concern
about climatic changes since Earth’s temperature, at that time, was rising.
These concerns prompted a number of other prominent scientists, de Saussure, R.
Bunsen, Max Pettenkoffer, Albert Kroch (Nobel Prize 1920) and Otto Warburg
(Nobel Prize 1931) to send air balloons equipped with special devices in the
Lower Atmosphere to trap the air and measure the atmospheric CO2
concentrations. For 151 years, 90000 measurements in 138 locations in 4
continents were carried out showing atmospheric CO2 concentrations
to vary from 290 ppm to 450 ppm (1820) with mean concentration for the 19th
century of 322 ppm. This prompted S. Arrehnius, in 1986, to correlate the
increase of atmospheric CO2 with the rise of temperature.The temperature increase since 1850,
that is after the Little Ice Age, is +![]() . b) from
1940 to 1980 temperature decreased by – 0,20C. c) from 1980 to 1998
temperature increased by +
. b) from
1940 to 1980 temperature decreased by – 0,20C. c) from 1980 to 1998
temperature increased by +
Atmospheric CO2 increase does not
follow temperature increase. Sometimes it coincides, 1980 to 1998, sometimes
not, 1999-2003, and sometimes deviates substantially, 2004-2008. This behavior
indicates that the continuous and increasing use of hydrocarbons cannot be connected with the erratic temperature
behavior. Therefore it seems that atmospheric CO2 concentrations are
not the driving force behind climatic changes but there are other
extraterrestrial drivers such as sunspots.
Keywords: climatic changes, atmospheric CO2,
mean Annual Temperatures,
Observatory, Sun spot number
![]() .
.
1. Introduction
Climatic changes and their causes have been put
forward by the United Nations administration, public media and various
environmental groups in order to show that there is an unprecedented temperature increase due to high
atmospheric CO2 levels. The latter is derived from human activities.
As a result of these activities ice caps will melt, resulting in the rise of
sea water. These statements create a phobia which leads to hysteria. We do not deny the existence of a serious environmental problem but the
use of fear to achieve any goal does not suit serious scientists.
![]()
2. Main Subject
Climatic changes have
been the subject of concern since the middle of the 18th century
(Martin, Wikipedia 2009, Ice Age). Since then a great number of scientists
tried to resolve the causes which promote such a behavior. Fourier, in 1782 with his work of “Theorie
Analytique de
Fig.1. Evidence of
variability of atmospheric CO2 concentration during the 20th century
in the Northern Hemisphere [4].
These measurements led S. Arrhenius
[5] to formulate the “Theory of Global warming by greenhouse gases the so
called Green House Effect”. This theory states that if the atmospheric CO2
levels increase by 2,5 to 3 times, presumably 900 ppm to 1200 ppm, temperatures
in Northern and Southern Poles will increase by 8![]() to 9
to 9![]() . In tantrum with these developments, Quaternary Geology was developed
in all universities and Geological services to solve the advance (Glacial Periods)
and retreat (Interglacial Periods) of Ice Fields from the continents. All these
scientific work has never been acknowledged by the scientists working for the
United Nations because in 1820 the atmospheric CO2 concentration was
quite high, 450 ppm, and the temperature was +
. In tantrum with these developments, Quaternary Geology was developed
in all universities and Geological services to solve the advance (Glacial Periods)
and retreat (Interglacial Periods) of Ice Fields from the continents. All these
scientific work has never been acknowledged by the scientists working for the
United Nations because in 1820 the atmospheric CO2 concentration was
quite high, 450 ppm, and the temperature was +![]() , [6] and 390 ppm in 1940 with Mean Annual Temperature of Earth’s
surface +
, [6] and 390 ppm in 1940 with Mean Annual Temperature of Earth’s
surface +
Another aspect which have been ignored is that
in the Quaternary during each Interglacial Period, which lasted over 20000
years, temperatures ranged from +
Finally one wonders if atmospheric CO2
concentrations measured in the air bubbles enclosed
in the ice cores reflect paleoatmospheric CO2 concentrations.
Besides the deviation from what was measured by the European scientists one
questions the following: How come with an increase of +![]() ) above the Mean Annual Temperature of Earth’s surface the recorded
atmospheric CO2 concentration to be measured at 385 ppm at Mauna Loa
Observatory, and with temperatures during the Eemian Period of +
) above the Mean Annual Temperature of Earth’s surface the recorded
atmospheric CO2 concentration to be measured at 385 ppm at Mauna Loa
Observatory, and with temperatures during the Eemian Period of +
Fig.2.Climatic changes as documented
from Vosto-1 icecore data [7], and EPICA ice core data, EPICA, 2004, for the
last 450000 years. Worth noticing is the rise of temperature well above the today’s one during
the long interglacial periods without the complete melting of the ice caps.
Fig. 3. Time lag between maximum
temperatures and atmospheric CO2 concentration during the Quaternary.[8].
Thus, a team of intellectuals and scientists that emanate mainly from
the positive sciences, they decided to resist to the climate of hysteria that
has been created. Characteristic it is the case of astrophysicist Piers Corbyn,
[9] author of Long-term Forecast of Solar Activity. This scientist rejects
completely the theory that the CO2 is person in charge for Global
Warming and the climatic change and he claims that it exists no element that
would announce that the CO2 increase
the temperature. This confirms also the measurements of CO2
in atmosphere from the most approved station of the world, Mauna Loa
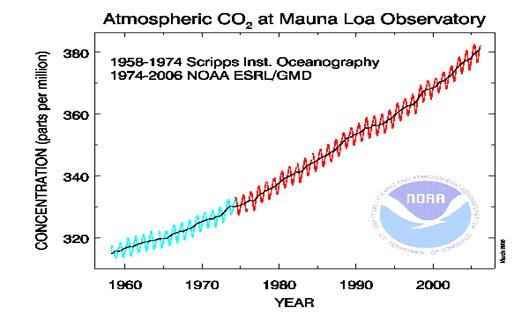
Fig.4. Atmospheric CO2 concentration from 1958, 315ppm, to 2008, 385 ppm,
Atmospheric CO2 at Mauna Loa Observatory, Hawaii, USA.[10].
It is obvious that the change of centesimal
composition of atmosphere at 7 thousandth in the 50 years does not justify the
concern and catastrophism that promotes us certain scientists. It is not
scientifically acceptable that the increase of atmospheric composition, least
from 1 molecule (substantially 0,7 molecules) CO2 in 10000 molecules
of gases that compose atmosphere can cause Global Warming.
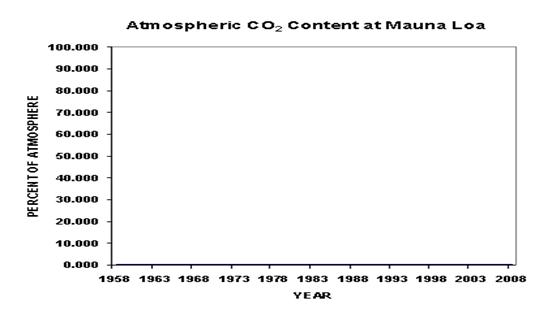
Fig. 5. Atmospheric CO2 increase
during the last 50 years expressed as a percent of the total air composition. It
is the, non discernible, blue line in the bottom. It is very
indiscernable azure (blue) line in the down part of diagram. The all surface
above the azure line him they constitute remainder airy that composes
atmosphere [11].
![]()
3.
The carbon dioxide is a thermostat of the planet?
In the antipode of the opinion that the CO2
in the atmosphere is the planet’s thermostat, we consider in conclusion the
following arguments:
2. Relation between temperature and CO2.
There is no connection between them. Perhaps they are connected in some complex
way, but there is no element establishing that the CO2
systematically raises the temperature. In reality, since 1998, temperature
levels worldwide have fallen (figures 6 and 10).
3. Measurements of CO2
concentrations in the atmosphere in the last 10 years (1998-2008), conducted by
Mauna Loa Observatory (Hawaii, USA), as well as measurements of Average Annual
Temperatures of Earth’s Surface, UK's Hadley Climate Research Unit, mean Annual
Temperatures of Lower Troposphere, NASA, Microwave Sounding Unit (figure 6),
show indisputably that there is no relation between CO2
concentrations in the atmosphere and the mean Annual Temperature of Earth’s
Surface and the mean Annual Temperature of Lower Troposphere. While the concentrations of CO2 in
the atmosphere went up by 77.8 billion tones compared to 1998-levels, the
temperatures not only didn’t go up, but from 2006 onwards they have decreased.
Figure 6. World temperature is falling
while atmospheric CO2 is rising. Data for a) Mean Temperature of Earth’s Surface:
![]()
4. Relation of Temperature
to Solar Activity
The fundamental periodicity of changes in
temperature corresponds to the 22-year magnetic cycle of the Sun (figure 7).
The current 22-year cycle has reached its peak in the years 2002 and 2003,
while we currently observe a decreasing trend (figure 8). In 2002 and 2003, the
fluctuating mean temperature reached its peak, which coincides with the phase
of the natural 22-year cycle. Thus, we can conclude that mean global
temperatures don’t increase; in the last 10 years, up to 2002, there has been
however a climax of the natural cycle, which is connected with the magnetic
22-year cycle of the Sun.
Fig.7. Sun
spot number variations from 1700 AD to 1995 AD.[13].
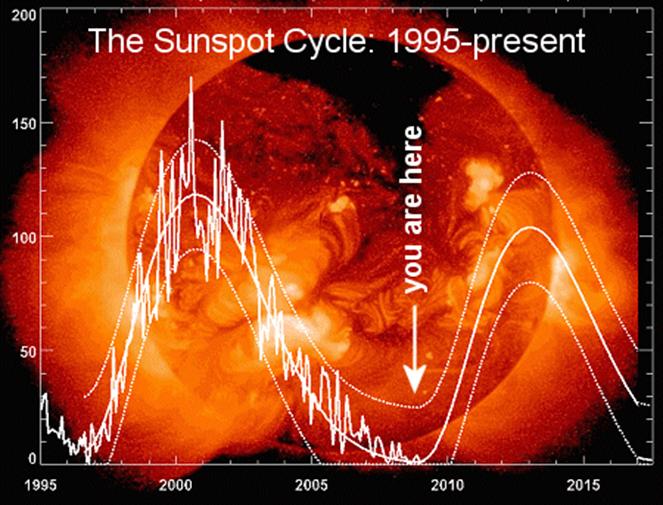
Fig. 8. Eleven (11) year sunspot cycle
from 1995 to present. The fluctuation of sunspot numbers is
characteristic.[14].
![]()
5.Research Method.
According
to our research: CO2
temperature and consumed quantity of hydrocarbons, are observed the
followings.
1. From 1850 until today, that is to say for
158 years, the mean Annual Temperatures of the Earth’s Surface amounted to +
0.7![]() , (Figure
10). Results from the famous Climatic Research Unit of the
, (Figure
10). Results from the famous Climatic Research Unit of the
Fig. 9. Left: Mean global-mean
anomalies. Right: Global map of surface temperature anomalies for 2008.
(Credit: NASA GISS).[15].
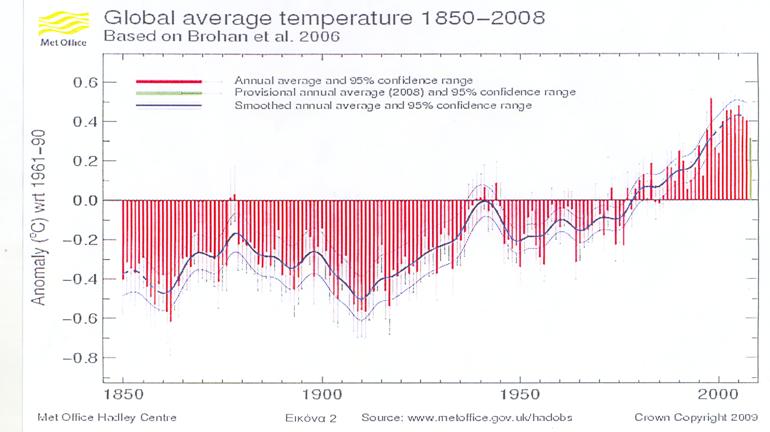
Fig. 10. Global temperature record 1850-2008.[16].
2. From 1910
until 1940, that is to say for 30 years, Mean Annual Temperatures of the
Earth’s Surface increased by + 0.6![]() even though
we have only consumed up to the 8% of the total consumed quantity of hydrocarbons, (Figure 10 and 11).
even though
we have only consumed up to the 8% of the total consumed quantity of hydrocarbons, (Figure 10 and 11).
3. From 1940 until 1975, that is to say for 35
years, Mean Annual Temperatures of the Earth’s Surface decreased by + 0.2![]() though we
have consumed only 40% of the total consumed quantity of hydrocarbons.
though we
have consumed only 40% of the total consumed quantity of hydrocarbons.
4. From 1975 until 1998, that is to say for 23
years , Mean Annual Temperatures of the Earth’s Surface increased by + 0.4![]() , (Figure 10
and 11), even though we have consumed up
to 38% of the total consumed quantity of
hydrocarbons.
, (Figure 10
and 11), even though we have consumed up
to 38% of the total consumed quantity of
hydrocarbons.
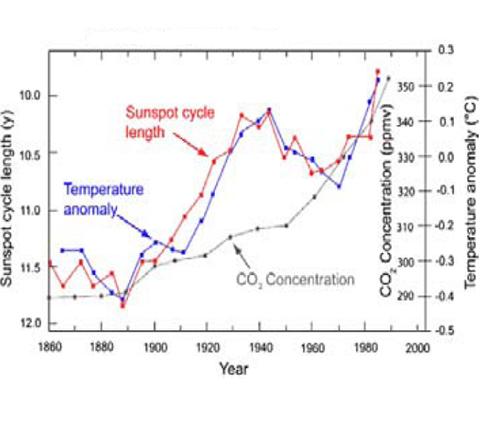
Fig.11. Correlation between sunspot cycle
length, temperature anomalies and atmospheric CO2 concentration.[17].
5. From 1999 until 2007 the Mean Annual Temperatures of Earth’s
Surface remained constant in + 0.4![]() , (figure
12, 13, 14, 15 and 16), even though we
have consumed up to 12% of the total,
consumed quantity of hydrocarbons.
, (figure
12, 13, 14, 15 and 16), even though we
have consumed up to 12% of the total,
consumed quantity of hydrocarbons.
![[grafima2.png]](sachinidis.files/image035.jpg)
Fig. 12.
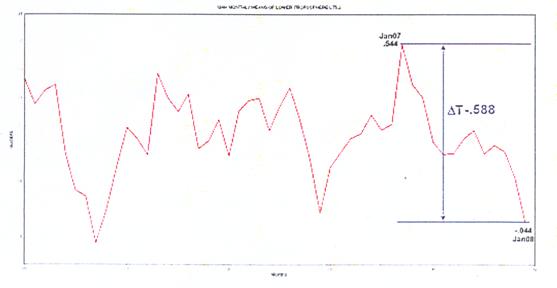
Fig.13
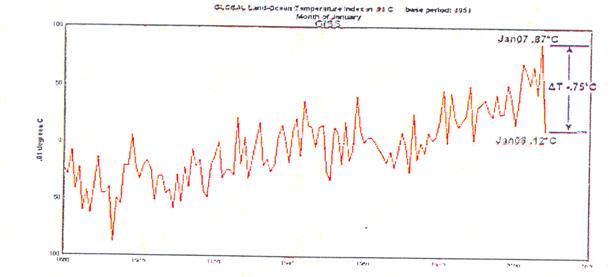
Fig. 14 .
![[grafima1.png]](sachinidis.files/image041.jpg)
Fig.15 Remote Sensing Systems of
6. From January 2007 until
January 2008 the Mean Annual Temperatures of Earth’s Surface cut down at - 0.64![]() , (Table 1),
that is the mean of fall which was recorded by the all stations. Figure 10
(last green bar).
, (Table 1),
that is the mean of fall which was recorded by the all stations. Figure 10
(last green bar).
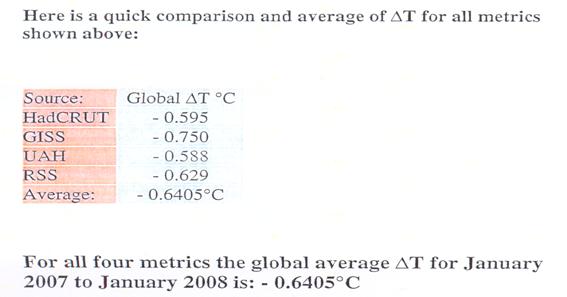
Table 1. For all
four metrics the global average, ΔT for January 2007 to
January 2008 is:-0.6405°C. [18].
7. If we compare
figures 1, 4, 6 and 10, we see clearly that there is
not any relation between the increase of Average Annual Temperature of Earth’s Surface and atmospheric CO2
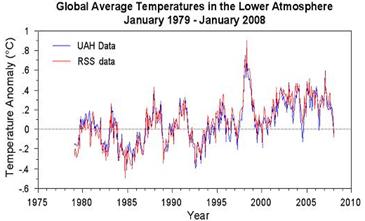
Fig.16.Global average temperature history (January 1979
through January 2008) of the lower troposphere as produced by researchers at
the University of Alabama-Huntsville (UAH, blue line) and from Remote Sensing Systems
(RSS, red line).[19].
Hence, these narrow-range fluctuations of
temperature do not foretell devastating phenomena for the human race, because
it is virtually impossible to predict the future long-term development of a
system, which is influenced by multiple factors, a system which is complex and
mainly chaotic, such as the climate. There is though another reason: in the
recent past of the human kind (Paleolithic era, Roman period, Byzantium and
Middle Ages), the temperatures oscillated from
Fig.17. Αverage near surface temperatures of the northern
hemisphere during the past 11000 years. [20], [21].
The
big climatic changes (period of glaciation, period of interglacial) (Figure
2 and 3), they are attributed in the orbital system of earth around the
sun, circles of Milankovitch, that became scientifically acceptable [22], while
the microclimatic changes, inside interglacial era, they are attributed in the
elation of not solar blots and the effect of solar winds, roughly 40000
tons/annually, [23], [24]. Sunspots are
storms on the sun’s surface that are marked by intense magnetic activity and
host solar flares and hot gassy ejections from the sun’s corona. The number of
spots on the sun cycles over time reaches a peak, the so-called Solar Maximum,
every 11 years. Solar winds, according to NASA’s
The big problem that humanity faces
today is not the increase of atmospheric CO2, because this subject
disorientates the governments and the entire world from the befalling whirlwind
that is the lack of cheap energy raw materials, (figure 18). For this reason,
we have to turn ourselves immediately in financing the growth of Renewable
Energy Sources, putting in second fate the costliest financing and inquiring
programs that are related with the reduction or the capture of emitted CO2.
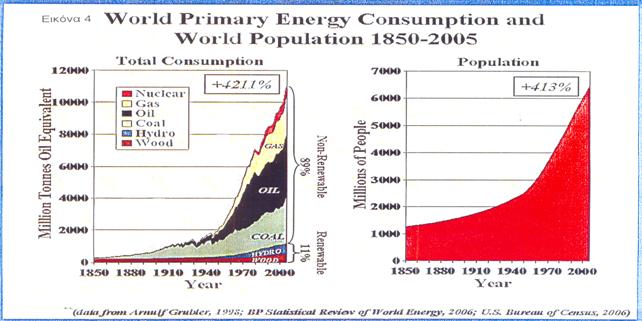
Fig.18.World consumption of primary energy and world increase of
population between 1850-2005 [25].
![]()
6.Results
and Conclusions
1. The climatic changes were the
subject of regular research of European scientists from the beginning of 19th century. The ignorance of all
the work done and of its full results places huge question marks in the world
scientific community that deals during the last 20 years, with the climatic
changes.
2.
There is not any relation between the concentrations of CO2 in the
atmosphere and the Mean Annual Temperature of Earth’s Surface. This appears of course:
a. From the delay of Annual Mean maximum Temperature of Earth’s Surface in
relation with the highest Concentration of CO2 in Atmosphere.
b. From the Annual Mean
Temperatures of Earth’s Surface,
UK's Hadley Climate Research Unit, the Mean Annual Temperatures of Low Troposphere,
[NASA], Microwave Sounding Unit, and the increase of concentrations of
atmospheric CO2, Mauna Loa Observatory, Hawaii, USA. On a five-year
period, while the concentrations of CO2 in atmosphere are
increasing, the temperatures are falling, a fact that outbids the opinion that
the hydrocarbons are not the only source of CO2 in the atmosphere,
but also that they do not influence the Mean
Annual Temperature of Earth’s Surface
. This is also confirmed:
g. From the big concentrations of CO2
in the atmosphere in 1820, 450 ppm, in
1860, 395 ppm and in 1940, 395 ppm, when the use of hydrocarbons was null or
too small.
3. The concentrations of CO2
in the atmosphere have increased by 70 ppm, during the last fifty-year period,
according to the measurements made by Mauna
Loa ![]() or
+0,30
or
+0,30 ![]() above the
15oC that is the normal Annual Mean Temperature of Earth’s Surface.
above the
15oC that is the normal Annual Mean Temperature of Earth’s Surface.
4. The increase of temperature from the end of
Little Ice Age season that lasted from 1350 - 1850 was of the order of + 0,70 ![]() ,
with a lot of fluctuations. The rise of temperature was of the order of +0,44
,
with a lot of fluctuations. The rise of temperature was of the order of +0,44![]() /100
years. The rise of Annual Mean Temperature of Earth’s Surface by +0,4
/100
years. The rise of Annual Mean Temperature of Earth’s Surface by +0,4![]() or +0,3
or +0,3![]() above the 15
above the 15![]() (the normal
Annual Mean Temperature of Earth’s
Surface), during the last 68 years, and with reducing tendencies during
the last 4 years, cannot be considered as something excessive and worrying,
because such fluctuations we had noticed from the last Ice Age season (18000 BC
till 1850 AD).
(the normal
Annual Mean Temperature of Earth’s
Surface), during the last 68 years, and with reducing tendencies during
the last 4 years, cannot be considered as something excessive and worrying,
because such fluctuations we had noticed from the last Ice Age season (18000 BC
till 1850 AD).
5. The increase of Annual Mean
Temperature of Earth’s Surface
should be attributed in the effect of solar blots that create the solar winds.
The last ones turn away the incident lactic ashes that are the cause of
creation or not of the clouds, depending on the intensity of solar winds.
Virtually, the micro-fluctuations of the temperatures are due to the “number
6. The micro-fluctuations of the temperatures are not forebode for
devastating phenomena for the human gender, because substantially it is
impossible to be forecasted, for the next 50 or 100 years, the future
development of such a multi-factorial, complicated and mainly chaotic system,
as it is the climate.
![]()
7.References
1..Fourier,
J. 1824."Remarques Générales sur les Températures Du
Globe Terrestre et des Espaces Planétaires." Annales de Chemie et de Physique 27:
136-67. Translation by
Ebeneser Burgess, "General Remarks on the Temperature of the Earth and
Outer Space," American Journal of Science 32: 1-20. (1837).
2.
3. Tyndall,
J. "On the Absorption and Radiation of Heat by Gases and Vapours." Philosophical
Magazine ser. 4, 22: 169-94, 273-85. (1861).
4.Beck,
E. G. 180 years
5.Arrhenius,
S. "On the Influence of Carbonic Acid in the Air Upon the Temperature of
the Ground." Philosophical
Magazine 41: 237-76. (1896).
6. Brohan, P., Kennedy, J.J.,
7.Petit,
J.R., Jouzel, J., Raynaud, D., Barkov, N.I., Barnola, J-M., Basile, I., Benders,
M., Chappellaz, J.,Davis, M., Delayque, G., Delmotte, M., Kotlyakov, V.M.,
Legrand, M., Lipenkov, V.Y., Lorius, C., Pépin, L., Ritz, C., Saltzman,
E., Stievenard, M. Climate and atmospheric history of the past 420,000 years
from the Vostok ice core, Antarctica. Nature 399: 429-436. (1999).
8.
Khilyuk, K. Chillingar G.V., Global warming: are we confusing cause and effect.
Energy Sources, 25 357-370. (2003).
9. Corbyn P.,. Do not bet on
man made origin of global warming. Executive Intelligence Review, June 1, 2007
Review. (2007).
10. Atmospheric CO2 at
Mauna Loa Observatory, Scripps Institute of Oceanography and US Department of
Commerce, National Oceanic and Atmospheric Administration, Earth System
Research Laboratory,Gas Monitoring Data (NOAA ESRL/GMD).Http.//en.wikipedia.org/wiki/File:
CO2-Mauna-Loa .png. www.jbs.org/jbs-news-feed/4333-fifty-years
-of -hot- air-(2007).
11.www.jbs.org/jbs-news-feed/4333-fifty-years
-of -hot- air-
12.http://icecap.us/images/uploads/Correlation
Last Decade pdf.
13. www.ngdc.noaa.gov/stp/SOLAR/SSN/ssn.html.
14. Hathaway, D..
What’s is wrong with the Sun?
(Nothing).science.nasa.gov/…./11 Jul- solarcycleupdate.html .
(2008).
15.giss.nasa.gov.data: http://www.giss.nasa.gov/data/update/gistemp/sectiondata/.
16.http://hadobs.metoffice.com/hadcrut3/diagnostics/global/nh+sh/).
17.Friis-Christensen, E. Correlation of sunspot activities with
temperature and CO2 concentration in the atmosphere. (2007).
http://www.friendsofscience.org/assets/files/documents/NORM20%K%20ROTARY%.
19. Global average temperature
history (January 1979 through January 2008) of the lower troposphere as
produced by researchers at the University of Alabama-Huntsville (UAH, blue
line) and from Remote Sensing Systems (RSS, red line). http://www.worldclimatereport.com/index.php/2008/02/07/more-satellite-musings/.(2008).
20. Dansgaard, W., Johnsen, S.J., Moller J. One thousand
centuries of climatic record from the
21.
Schonwiese, C., Klimaanderungen: Daten, Analysen, Prognosen. Springer,
Heidelberg. (1995).
22.
Hayes, J.,
Imbrie, J., Shackleton N. J. Variation in the Earth’s Orbit: Pacemaker of the
Ice Ages. Science, v 194, No. 4270, 1121-1132 pp.(1976).
23.
Murad, E., Williams, I. P. Meteors in the Earth’s Armosphere: Meteoroids and
Cosmic Dust and their Interaction with Earth’s Upper Atmosphere.
24.
Landgraf, M. Galactic dust storm enters Solar System. www. Mewscientist.com/.../dn4021-galactic-dust-storm-enters-solar-system.html.
(2003).
25. BP Statistical Review of World Energy,.
http//www.bp.com/productlanding. do? categoryld=6929&contentld=7044622,
38K, 48p. (2008).
![]()
©
Copyright-VIPAPHARM. All rights reserved

![]()
web hosting and internet marketing by Siteowners Ltd